canvas饼状图+解释文本
制作canvas饼状图步骤
- 绘制饼状图
- 绘制注释线及其解释文
- 绘制小矩形进行数据说明
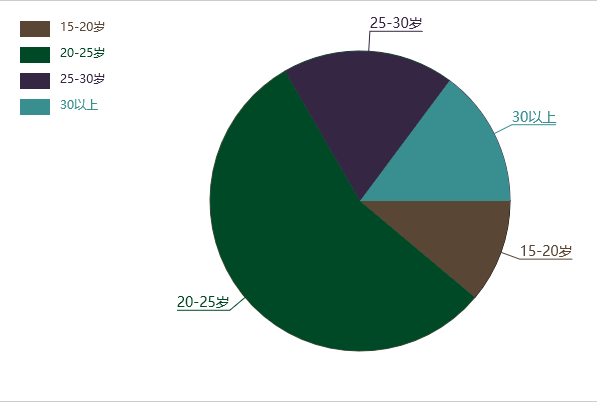
效果图
代码
        var PieChart = function (ctx) {
                this.ctx = ctx || document.querySelector('canvas').getContext('2d');
                this.w = this.ctx.canvas.width        //获取canvas宽度
                this.h = this.ctx.canvas.height        //获取canvas高度
                this.x0 = this.w/2 + 60             //获取原点x
                this.y0 = this.h/2                    //获取原点y
                this.radius = 150                    //获取半径
                this.outLine = 20        //圆盘外面的线长度
                this.rectW = 30            //小矩形的宽度
                this.rectH = 16            //小矩形的高度
                this.space = 20            //小矩形距离边框
            }
        //传入数据
            PieChart.prototype.init = function(data) {
                this.drawPie(data)
            }
        //画饼状图
            PieChart.prototype.drawPie = function (data) {
                var that = this
                var angleList = this.transformAngle(data)    //数组
                var startAngle = 0
                angleList.forEach(function (item,i){
                    var endAngle = startAngle + item.angle
                    that.ctx.beginPath()
                    that.ctx.moveTo(that.x0, that.y0)
                    that.ctx.arc(that.x0, that.y0, that.radius, startAngle, endAngle);
                    var color = that.ctx.fillStyle = that.getRandomColor()
                    that.ctx.stroke()
                    that.ctx.fill();
                    that.drawTitle(startAngle, item.angle, color, item.title)
                    that.drawDesc(i,item.title)
                    startAngle = endAngle
                })
            }
        //画注释线及其解释
            PieChart.prototype.drawTitle = function (startAngle,angle,color,title) {
                var edge = this.radius + this.outLine
                var edgeX = Math.cos(startAngle + angle / 2) * edge
                var edgeY = Math.sin(startAngle + angle / 2) * edge
                var outX = this.x0 + edgeX
                var outY = this.y0 + edgeY
                this.ctx.beginPath()
                this.ctx.moveTo(this.x0 ,this.y0);
                this.ctx.lineTo(outX,outY);
                this.ctx.strokeStyle = color;
                this.ctx.font = '14px Microsoft YaHei';
                var textWidth = this.ctx.measureText(title).width
                if(outX > this.x0){
                    this.ctx.lineTo(outX + textWidth , outY)
                    this.ctx.textAlign = 'left'
                }else{
                    this.ctx.lineTo(outX - textWidth , outY)
                    this.ctx.textAlign = 'right'
                }
                this.ctx.stroke();
                this.ctx.textBaseline = 'bottom'
                this.ctx.fillText(title, outX, outY)
            }
        //画小矩形说明
            PieChart.prototype.drawDesc = function (index,title) {
                this.ctx.fillRect(this.space,this.space + index * (this.rectH + 10),this.rectW,this.rectH)
                this.ctx.beginPath()
                this.ctx.textAlign = 'left'
                this.ctx.textBaseline = 'top';
                this.ctx.font = '12px Microsoft YaHei'
                this.ctx.fillText(title,this.space + this.rectW + 10 ,this.space + index * (this.rectH + 10))
            };
        //将数据转换为弧度
            PieChart.prototype.transformAngle = function (data) {
                var total = 0
                data.forEach(function(item, i){
                    total += item.num
                })
                data.forEach(function(item, i){
                    var angle = item.num / total *Math.PI *2
                    item.angle = angle
                })
                return data
            }
        //生成随机颜色
            PieChart.prototype.getRandomColor = function () {
                var r = Math.floor(Math.random() * 256)
                var g = Math.floor(Math.random() * 256)
                var b = Math.floor(Math.random() * 256)
                return 'rgb(' + r +','+ g + ','+ b +')';
            }
        //数据
        var data = [
            {title: '15-20岁',num: 6},
            {title: '20-25岁',num: 30},
            {title: '25-30岁',num: 10},
            {title: '30以上',num: 8}
        ];
        var pirChart = new PieChart();
        pirChart.init(data)